Interactive plot for molecules
Over the past months I was working on a fingerprint analysis in a dataset of my interest. When I obtained the data on a plot I was not happy about just to show the data points without any labels on it. When I searched more about ways to show labels on a plot I found that it was possible to hover data over points on scatterplots! And then I thought with myself: "Hey, Can I hover images over my plots? It would be amazing if people could get my analysis and just go exploring the molecules!".
I searched a lot, but unfortunately found no library that I could use just python to implement in my code... But... I found bokeh!
Even though bokeh was made to implement on python codes with NumPy, Scipy, Pandas, Scikit-Learn and others, the coding of some plot details is on html and I had no knowledge to implement html on my python code. So I decided not to use it on my dataset... But it was so tempting not to learn about its hover over a dot functionality...
Bokeh is a great library to build interactive plots that can make your client or audience explore the analysis of the data. For example, in the image below, published at the bokeh site, the user can explore the data themselves, increasing the familiarity and interest for the information you have. This is really important for storytelling!

Bokeh interactive plot
I decided to apply the hover over a point functionality on a dataset of 9 compounds that I retrieved from rdkit github. So, first of all I had to generate the images of the compounds. I used rdkit library in the images.py to do this.
With Chem.SDMolSupplier I supplied the molecules from a molfile dataset, computed the 2D coordinates using AllChem.Compute2DCoords and drawn the molecules using rdMolDraw2D.MolDraw2DCairo. The mol.GetProp module was used to get the name of the molecule to name the output files. images.py:
from rdkit.Chem.Draw import rdMolDraw2D
from rdkit.Chem import AllChem
from rdkit import Chem

# Adapted from Oliver Scott at
# https://stackoverflow.com/questions/65823691/how-would-you-convert-a-large-sdf-file-of-chemical-compounds-into-individual-fil

img_size = (600, 600)
supplier =  Chem.SDMolSupplier('resources/dataset/dataset.sdf')
for mol in supplier:
    AllChem.Compute2DCoords(mol)
    property = mol.GetProp('chembl_pref_name')
    d = rdMolDraw2D.MolDraw2DCairo(*img_size)
    d.DrawMolecule(mol)
    d.FinishDrawing()
    d.WriteDrawingText(f'resources/images/{property}.png')
And the molecules was generated as it follows:
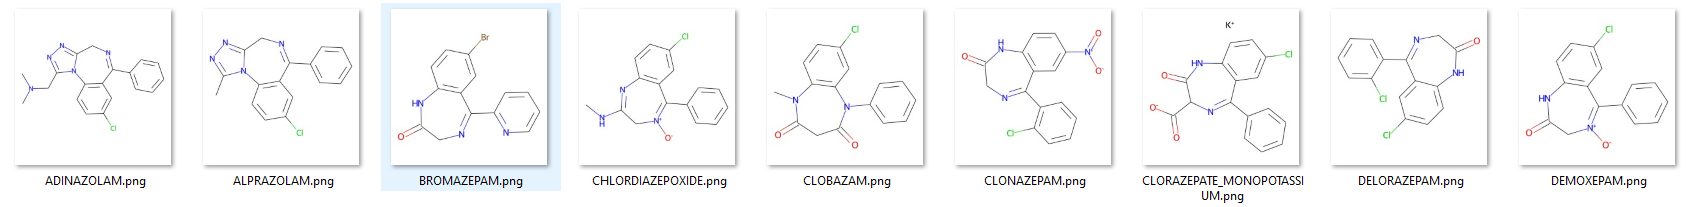
Molecules generated using images.py
With the compound images generated, all I had to do was to plot some information. As the purpose of this exercice was not to study any property, I just used random.randint to generate some random data.
From bokeh.plotting in interactive_plot.py, ColumnDataSource was used to get the data in a dictionary format and from bokeh.models, HoverTool was used to implement the hover over a dot functionality. On source, desc was used to describe the name of the compounds to be used as the legend of the image and in imgs is the path of the file. It is possible to change the size, margin, border and style of the image at hover < img >< /img > and legend style at < span < /span >. To generate the plot, figure from bokeh.plotting is used. The p.circle is used to edit the size of the data points. To save the plot is necessary to use output_file from bokeh.plotting. interactive_plot.py:
from bokeh.plotting import figure, output_file, show, ColumnDataSource
from bokeh.models import HoverTool
from numpy import random

output_file("interactive_plot.html")

source = ColumnDataSource(
        data=dict(
            x=random.randint(100, size=(9)),
            y=random.randint(100, size=(9)),
            desc=['ADINAZOLAM', 'ALPRAZOLAM', 'BROMAZEPAM', 'CHLORDIAZEPOXIDE', 'CLOBAZAM',
                'CLONAZEPAM', 'CLORAZEPATE_MONOPOTASSIUM', 'DELORAZEPAM', 'DEMOXEPAM'],
            imgs = [
                'resources/images/ADINAZOLAM.png',
                'resources/images/ALPRAZOLAM.png',
                'resources/images/BROMAZEPAM.png',
                'resources/images/CHLORDIAZEPOXIDE.png',
                'resources/images/CLOBAZAM.png',
                'resources/images/CLONAZEPAM.png',
                'resources/images/CLORAZEPATE_MONOPOTASSIUM.png',
                'resources/images/DELORAZEPAM.png',
                'resources/images/DEMOXEPAM.png',
            ]
        )
    )

hover = HoverTool(
        tooltips="""
        <div>
            <div>
                <img
                    src="@imgs" height="200" alt="@imgs" width="200"
                    style="float: left; margin: 15px 15px 15px 15px;"
                    border="0"
                ></img>
            </div>
            <div>
                <span style="font-size: 14px; font-weight: bold;">@desc</span>
            </div>
        </div>
        """
    )

p = figure(plot_width=600, plot_height=600, tools=[hover],
           title="Interactive plot")

p.circle('x', 'y', size=20, source=source)

show(p)
And then its done!
Plot generated using interactive_plot.py
In the future, I want to apply this interactive visualization to the analysis of some properties of a dataset. I want to understand how to integrate html to python coding.
I hope you liked this information and if you want the full code to test, it is on my github page.